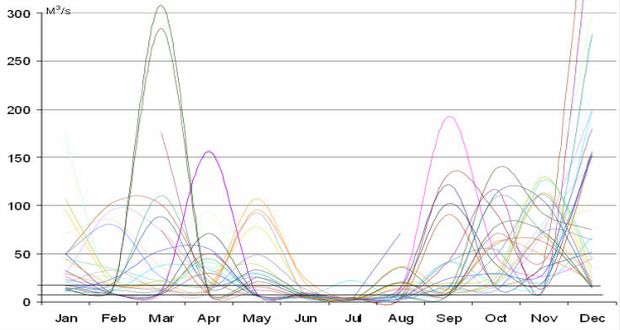
Each colour represents and average monthly water flow over 31 years. The maximum expected to flow through the turbine will be less than 12m3/s; being a small portion of the whole. The turbine will be automatically powered down under low flow conditions to enable priority to be given to the two fish passes.
(The higher line below representing indicative flow with two fish passes and the existing centre weir “notch” ).
This diagram shows how the calculations for the power generated by both turbines is based on theaverage monthly water flow.
 Halton Lune Hydro The biggest community hydro in England
